Lyft - Autonomous Console. Visual Design UI / UX / Interactions.
Year: 2016
Role: Lead Visual Designer for Lyft Autonomous Program
Company: Lyft, Inc.
Tools: Sketch, After Effects, Photoshop, Illustrator, Unity, Maya, Houdini.
Study in Current Technology - Lidar Simulations
As an initial audit at the many visualization techniques used in the vast range of autonomous vehicle companies, One can't help to very quickly notice the reliance on lidar systems as one of the principal methods to display what the vehicle sees. At first glance, it almost looks as if a big omnidirectional light was placed in the center top of the vehicle and emitted its light into the world. In fact, it is a series of lasers that are projected out through a rotational system many times a second. The lasers collide with objects in the world and each point of collision is recorded in three-dimensional space along the thousands (depending on the sensor capability) of others points. These points are displayed a certain amount of times a second (frame rate) in a local three-dimensional space creating what is called a "Point Cloud." The visualization runs real-time, and the resulting images are somewhat descriptive of the world around the car. The world and the objects around are quickly recognizable by those who have a sense of the technology happening behind the curtains. That was our main observation; there is where our problem laid, for those familiar with the technology, a Lidar point cloud visualization was more than enough, but what about those who were not Familiar?
People, in general, do not trust self-driving vehicles. I guess there is a correlation between the absence of a human operator behind the wheel on any piece of moving or functioning machinery, and the fact that in ANY other condition, (other than a self-driving vehicle,) this will represent BIG trouble (a truck with no driver behind the wheel, construction machinery with no operator behind the wheel, an airplane with no pilot, etc.) Anywhere you look at there is a significant bias towards humans trusting humans (who have a much higher national rate of accidents and fatalities) and against self-driving vehicles (which have a minuscule number of accidents AND fatalities in comparison to humans.)
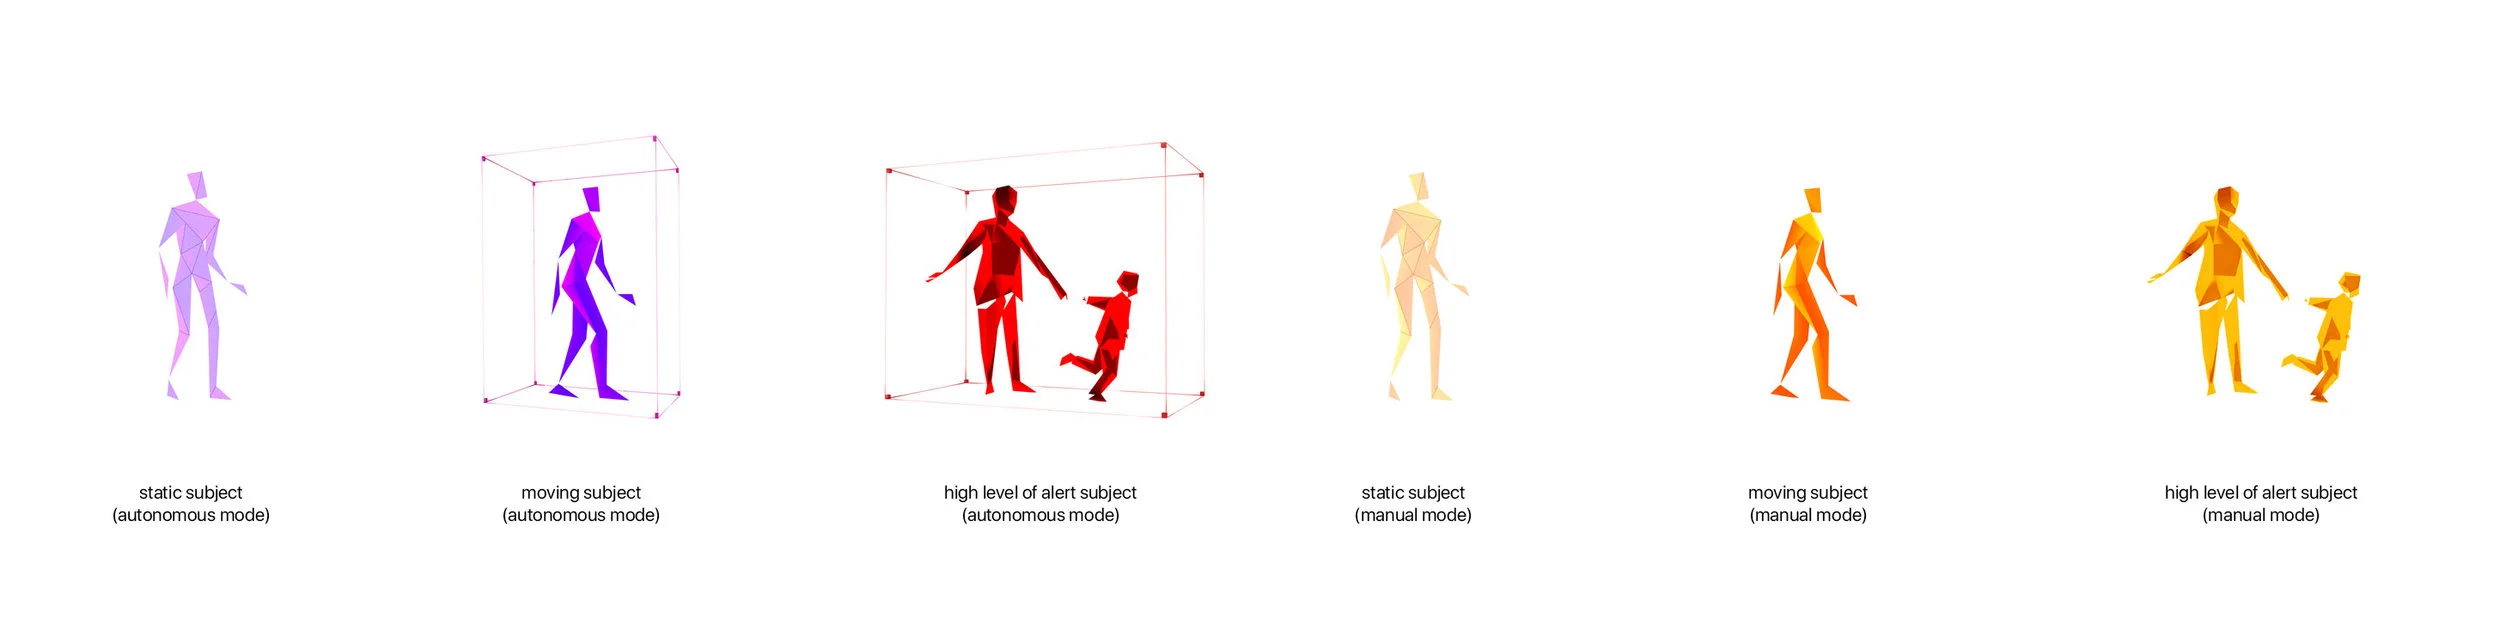
That was the task of the visualization system in the console; to humanize the incoming data from the many sensors, and the clasified data from other methods (not government classified) and display it to the user in a clear, elegant and honest way. If we did our job right, the user would be able to read and have a clear idea of the self-driving vehicles's understanding of the world. Once the user had created this relationship with the vehicle, in a perfect world, the user would move into other amenities that come with a self-driving vehicle like personalized controls, music, movie watching, video calls and many more. We did realize that the life of the visualization system was limited. New generations that would grow up with self-driving vehicles in their lives would not have the need for a visualization system and would trust the technology in "a priori" terms. This would happen in the same way, airplane pilots do not need recurring visual feedback of the autopilot system when engaged(other than a light.) The auto-pilot system is activated by the pilot, and the pilot goes on with other tasks.
Lidar had, as great of a visualization technique as it was, many shortcomings in its approach as a method for making other humans understand the perception of the world from of a self-driving vehicle. By the angular distribution of the points (coming out of a centroid,) closer objects received a higher number of points, making the closer objects, by default, more descriptive than further objects. Also by this same method of point distribution (somewhat of a ray-casting method,) objects or features further away received a less number of points making the depiction of the rest of the world, very hard to understand and perceive, i.e. , a walking pedestrian would obstruct the laser dot projection on a building by standing closer to the vehicle and the building behind would get almost no points, therefore making its description very low and/or hard to perceive.